

Danaos Corporation, one of the world’s largest independent owners of container vessels, reported unaudited results for the period ended December 31, 2025.
For management purposes, the Company is organized based on operating revenues generated from container vessels and drybulk vessels and has two reporting segments: (1) a container vessels segment, and (2) a drybulk vessels segment. The Company measures segment performance based on net income. Items included in the applicable segment’s net income are directly allocated to the extent that the items are directly or indirectly attributable to the segments. With regards to the items that are allocated by indirect calculations, their allocation is commensurate to the utilization of key resources. The Other column includes components that are not allocated to any of the Company’s reportable segments and includes investments in an affiliate accounted for using the equity method of accounting and investments in marketable securities.
Highlights for the Fourth Quarter and Year Ended December 31, 2025 and up to date of this release:
Financing developments
- On October 16, 2025, the Company successfully placed a $500 million senior unsecured bond with a seven-year tenor and a coupon of 6.875%. On December 1, 2025, we utilized $111.4 million from this offering towards early repayment of two secured credit facilities, and we have issued a redemption notice to repay in full early on March 2, 2026 our 8.5% senior notes due 2028 with an outstanding principal amount of $262.8 million. The remaining proceeds, after application to refinancing-related costs and expenses, including fees and commissions, are available for general corporate purposes.
- As of December 31, 2025, out of our total 85 vessel fleet, we have 77 debt free vessels of which 61 are unencumbered and 16 are encumbered in connection with our $382.5 million Revolving Credit Facility on which no debt has been drawn.
- We have entered into Japanese Operating Lease (“Jolco”) transactions for two of our recently delivered newbuilding vessels, ‘Phoebe’ and ‘Greenhouse’ that were refinanced out of our $450 million syndicated credit facility that originally housed them. The Jolco transactions were consummated on October 30, 2025 and January 15, 2026, respectively, each for a consideration of $80 million and a tenor of eight years.
Fleet developments
- Since our previous earnings announcement we have added four 5,300 TEU containership vessels to our orderbook with deliveries in 2028 and 2029.
- As a result, our containership orderbook currently consists of 27 newbuilding containership vessels with an aggregate capacity of 174,550 TEU with expected deliveries of three vessels in 2026, thirteen vessels in 2027, seven vessels in 2028 and four vessels in 2029. All vessels in our orderbook are designed with the latest eco characteristics and will be built in accordance with the latest requirements of the International Maritime Organization (IMO) in relation to Tier III emission standards and Energy Efficiency Design Index (EEDI) Phase III.
- In relation to our dry bulk fleet, we have placed orders for two Newcastlemax dry bulk carriers of approximately 211,000 DWT capacity each, with expected delivery dates in 2028 while, as previously announced, we expect to take delivery of a secondhand Capesize dry bulk vessel towards the end of the first quarter of 2026.
- On a pro forma, fully delivered basis, assuming the delivery of all vessels currently under construction and on order, our fleet would consist of 102 containerships with an aggregate capacity of approximately 652,041 TEUs and 13 dry bulk vessels, comprising 11 Capesize bulk carriers and two Newcastlemax bulk carriers, with an aggregate capacity of approximately 2.37 million DWT.
Chartering developments
- Since the date of our previous earnings release, we have added approximately $428 million to our contracted revenue backlog through a combination of charter extensions and forward new charters for 17 of our existing container vessels.
- As a result, total contracted operating revenues, based on concluded charter contracts through the date of this release, currently stand at $4.3 billion, including newbuildings. The remaining average contracted charter duration for our containership fleet is 4.3 years, weighted by aggregate contracted charter hire.
- Contracted operating days charter coverage for our container vessel fleet is currently 100% for 2026, 87% for 2027 and 64% for 2028. This includes newbuildings based on their scheduled delivery dates.
New Investments
- On January 20, 2026, the Company announced a strategic partnership with Glenfarne Group to advance the Alaska LNG project. This partnership includes a $50 million development capital equity investment in Glenfarne Alaska Partners LLC. In addition, Danaos Corporation will also be the preferred tonnage provider to construct and operate at least six LNG carriers to deliver LNG to global customers for Glenfarne Alaska LNG, LLC, majority owner and developer of the Alaska LNG Project. This transaction provides Danaos with an opportunity to capitalize on its expertise in global seaborne transportation and expand the footprint of Danaos in the LNG and Energy segments.
Share buy-back and dividends
- As of the date of this release, Danaos has repurchased a total of 3,247,444 shares of its common stock in the open market for $235.1 million under its $300.0 million authorized share repurchase program, that was originally introduced in June 2022 and was upsized twice in $100.0 million increments, in November 2023 and in April 2025.
- Danaos has declared a dividend of $0.90 per share of common stock for the fourth quarter of 2025. The dividend is payable on March 4, 2026, to stockholders of record as of February 23, 2026.
Danaos’ CEO Dr. John Coustas commented:
In this quarter it became evident that the business community continues to adapt quickly to geopolitical disruptions. Despite concerns that tariff and geopolitical uncertainty would cause a U.S. slowdown, it has not materialized. At the same time, the hype around AI-related investments has increased optimism, China’s exports continue to set new records and consequently container volumes have reached record highs. With the Suez Canal still largely avoided by major liners, and trade patterns increasingly transforming to multipolar, demand for midsize vessels has remained very strong.
Against this background we continued our strategy of securing long term employment for our existing vessels through forward fixtures by either extending existing charters or by new charters even for late 2027 dates. We also continued to invest in modern container vessels. We ordered six 1,800 TEU vessels, four 5,300 TEU vessels, and two 211k DWT Newcastlemax dry bulk vessels for deliveries in 2028 and 2029. We have secured 10-year charters for four of these vessels, and the Company’s total contracted revenue increased to $4.3 billion as of the end of the quarter, giving us great earnings visibility into the future from which we derive comfort on our ability to manage any eventual future market developments.
On the financing front, we completed a seven-year $500 million unsecured bond offering at 6.875% coupon, one of the most competitively priced deals ever achieved in the shipping industry for an unsecured bond of such tenor, further diversifying the capital structure and re-affirming our access to the deep and liquid international debt capital markets.
Our liquidity at year-end reached $1.4 billion. Backed by a strong financial profile, we have begun exploring selective investments in the energy sector to broaden revenue sources and expand in the LNG business. In this context, Danaos became a strategic investor in the Alaska LNG project, providing access to LNG transportation opportunities associated with a facility planned to produce 20 MTPA annually.
The Company remains focused on positioning itself at the forefront of shipping and energy growth areas for the benefit of our shareholders.
Three months ended December 31, 2025 compared to the three months ended December 31, 2024
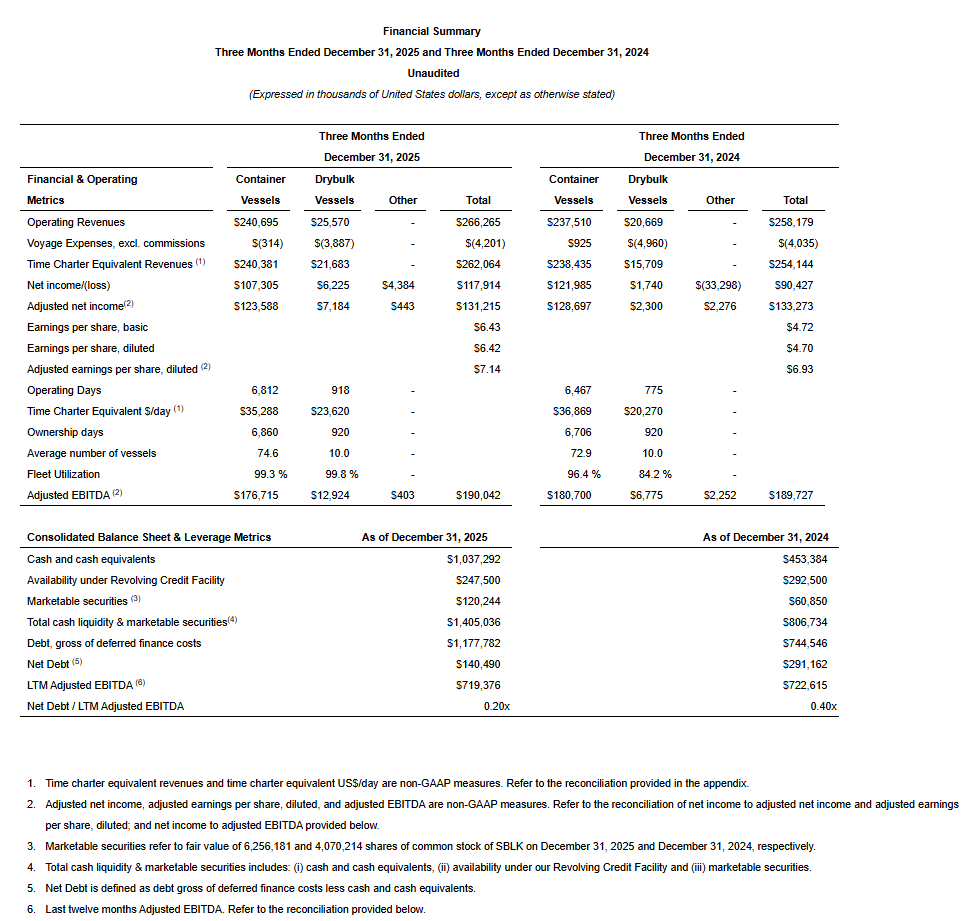
During the three months ended December 31, 2025, Danaos had an average of 74.6 container vessels and 10 capesize drybulk vessels compared to 72.9 container vessels and 10 capesize drybulk vessels during the three months ended December 31, 2024. Our container vessels utilization for the three months ended December 31, 2025 was 99.3% compared to 96.4% in the three months ended December 31, 2024. Our drybulk vessels utilization for the three months ended December 31, 2025 was 99.8% compared to 84.2% in the three months ended December 31, 2024.
Our adjusted net income amounted to $131.2 million, or $7.14 per diluted share, for the three months ended December 31, 2025 compared to $133.3 million, or $6.93 per diluted share, for the three months ended December 31, 2024. We have adjusted our net income in the three months ended December 31, 2025 for $14.7 million of stock based compensation expense and one-off discretionary cash bonus, a $3.9 million gain from the change in fair value of investments, a $1.4 million loss on debt extinguishment and a $1.2 million non-cash finance fees amortization.
Adjusted net income of our container vessels segment amounted to $123.6 million for the three months ended December 31, 2025 compared to $128.7 million for the three months ended December 31, 2024. We adjusted net income of container vessels segment in the three months ended December 31, 2025 for a $13.7 million of stock based compensation expense and one-off discretionary cash bonus, a $1.4 million loss on debt extinguishment and a $1.2 million non-cash finance fees amortization.
Adjusted net income of our drybulk vessels segment amounted to $7.2 million for the three months ended December 31, 2025 compared to $2.3 million for the three months ended December 31, 2024. We adjusted net income of drybulk vessels segment in the three months ended December 31, 2025 for a $1.0 million of stock based compensation expense and one-off discretionary cash bonus.
The $2.1 million decrease in our adjusted net income for the three months ended December 31, 2025 compared to the three months ended December 31, 2024 is primarily attributable to (i) a $6.6 million increase in total operating expenses, (ii) a $2.1 million decrease in claims received, (iii) a $1.8 million decrease in dividends received, (iv) a $0.1 million increase in equity loss on investments, offset by (v) a $8.1 million increase in operating revenues, and (vi) a $0.4 million decrease in net finance expenses.
Please refer to the Adjusted Net Income reconciliation tables, which appear later in this earnings release.
On a non-adjusted basis, our net income amounted to $117.9 million, or $6.42 earnings per diluted share, for the three months ended December 31, 2025 compared to net income of $90.4 million, or $4.70 earnings per diluted share, for the three months ended December 31, 2024. Our net income for the three months ended December 31, 2025 includes $3.9 million gain on marketable securities (gross of dividend income) compared to $35.6 million loss on marketable securities (gross of dividend income) in the three months ended December 31, 2024. On a non-adjusted basis, the net income of our container vessels segment amounted to $107.3 million for the three months ended December 31, 2025 compared to $122.0 million for the three months ended December 31, 2024. On a non-adjusted basis, the net income of our drybulk vessels segment amounted to $6.2 million of net income for the three months ended December 31, 2025 compared to $1.7 million of net income for the three months ended December 31, 2024.
Operating Revenues
Operating revenues increased by 3.1%, or by $8.1 million, to $266.3 million in the three months ended December 31, 2025 from $258.2 million in the three months ended December 31, 2024.
Operating revenues of our container vessels segment increased by 1.3%, or $3.2 million, to $240.7 million in the three months ended December 31, 2025 from $237.5 million in the three months ended December 31, 2024, analyzed as follows:
- $7.8 million increase in revenues as a result of higher fleet utilization between the two periods;
- $5.2 million increase in revenues as a result of newbuilding containership vessel additions;
- $7.8 million decrease in revenues as a result of lower charter rates between the two periods; and
- $2.0 million decrease in revenues due to lower non-cash revenue recognition in accordance with US GAAP.
Operating revenues of our drybulk vessels segment increased by 23.7%, or by $4.9 million, to $25.6 million in the three months ended December 31, 2025, compared to $20.7 million of revenues in the three months ended December 31, 2024, as a result of improved charter rates and higher dry bulk vessel utilization between the two periods.
Vessel Operating Expenses
Vessel operating expenses increased by $2.8 million to $48.4 million in the three months ended December 31, 2025 from $45.6 million in the three months ended December 31, 2024, primarily as a result of the increase in the average number of vessels in our fleet due to container vessel newbuilding deliveries and the increase in average daily operating cost of our vessels to $6,377 per vessel per day for the three months ended December 31, 2025 compared to $6,135 per vessel per day for the three months ended December 31, 2024. Management believes that our daily operating costs remain among the most competitive in the industry.
Depreciation & Amortization
Depreciation & Amortization includes Depreciation and Amortization of Deferred Drydocking and Special Survey Costs.
Depreciation
Depreciation expense increased by $1.1 million, to $41.5 million in the three months ended December 31, 2025 from $40.4 million in the three months ended December 31, 2024 due to the increase in the average number of vessels in our fleet.
Amortization of Deferred Drydocking and Special Survey Costs
Amortization of deferred drydocking and special survey costs increased by $1.5 million to $10.8 million in the three months ended December 31, 2025 from $9.3 million in the three months ended December 31, 2024.
General and Administrative Expenses
General and administrative expenses increased by $6.7 million, to $28.4 million in the three months ended December 31, 2025 from $21.7 million in the three months ended December 31, 2024. The increase was mainly attributable to a one-off discretionary cash bonus of $4.8 million distributed to certain employees, a $1.8 million increase in stock based compensation expense, a $0.2 million higher management fees due to the increase in the average number of vessels in our fleet partially offset by a $0.1 million decrease in corporate general and administrative expenses.
Other Operating Expenses
Other Operating Expenses include Voyage Expenses.
Voyage Expenses
Voyage expenses increased by $0.1 million to $14.2 million in the three months ended December 31, 2025 from $14.1 million in the three months ended December 31, 2024.
Voyage expenses of our container vessels segment increased by $0.8 million to $8.8 million in the three months ended December 31, 2025, from $8.0 million in the three months ended December 31, 2024, mainly due to increased other voyage expenses.
Voyage expenses of our dry bulk vessels segment decreased by $0.7 million, to $5.4 million in the three months ended December 31, 2025, compared to $6.1 million voyage expenses in the three months ended December 31, 2024. For the three months ended December 31, 2025, voyage expenses of our dry bulk vessels comprised of $1.5 million in commissions and $3.9 million in other voyage expenses, mainly comprised of bunkers cost and port expenses, compared to $1.1 million in commissions and $5.0 million in other voyage expenses for the three months ended December 31, 2024, reflecting an increase in time charter employment of our dry bulk vessels during the three months ended December 31, 2025 compared to the three months ended December 31, 2024.
Interest Expense and Interest Income
Interest expense increased by $4.7 million, to $14.6 million in the three months ended December 31, 2025 from $9.9 million in the three months ended December 31, 2024. The increase in interest expense is a result of:
- $5.8 million increase in interest expense due to an increase in our average indebtedness by $397.1 million between the two periods, partially offset by a decrease in our average debt service cost. Average indebtedness was $1,144.3 million in the three months ended December 31, 2025, compared to average indebtedness of $747.2 million in the three months ended December 31, 2024, while our average debt service cost decreased by approximately 0.5% mainly as a result of lower SOFR rates between the two periods;
- $0.5 million increase in the amortization of deferred finance costs and debt discount between the two periods; and
- $1.6 million decrease in interest expense due to an increase in the amount of interest expense capitalized on our vessels under construction that was $6.3 million in the three months ended December 31, 2025, when compared to capitalized interest of $4.7 million in the three months ended December 31, 2024.
As of December 31, 2025, our outstanding debt, gross of deferred finance costs, was $1,177.8 million, which include $262.8 million principal amount of the 8.5% Senior Notes, which we will redeem in full on March 2, 2026, and $500.0 million principal amount of the 6.875% Senior Notes. These balances compare to debt of $744.5 million, which included $262.8 million principal amount of the 8.5% Senior Notes as of December 31, 2024. The increase in our outstanding debt is mainly due to (i) the issuance of the $500.0 million aggregate principal amount of the 6.875% Senior Notes in October 2025, (ii) the loans drawn down to partially finance our container vessel newbuildings, partially offset by (iii) the early prepayment of two secured facilities.
Interest income increased by $4.6 million to $8.5 million in the three months ended December 31, 2025 compared to $3.9 million in the three months ended December 31, 2024, mainly driven by higher average cash balances between the two periods, partially offset by lower interest rates on cash deposits.
Gain/(Loss) on Investments
The $4.6 million gain on investments in the three months ended December 31, 2025 consisted of the gain from the change in fair value of our shareholding interest in Star Bulk Carriers Corp. (“SBLK”) of $3.9 million and dividend income on these shares of $0.7 million. This compares to a $33.1 million loss on investments in the three months ended December 31, 2024, representing a $35.6 million loss from the change in fair value change on our SBLK shareholding interest, which was partially offset by dividend income on these shares of $2.5 million.
Loss on Debt Extinguishment
The loss on debt extinguishment of $1.4 million in the three months ended December 31, 2025 related to our early extinguishment of debt compared to nil in the three months ended December 31, 2024.
Equity Loss on Investments
Equity loss on investments amounting to $0.3 million and $0.2 million in the three months ended December 31, 2025 and 2024, respectively, relates to our share of initial expenses of Carbon Termination Technologies Corporation (“CTTC”), currently engaged in the research and development of decarbonization technologies for the shipping industry.
Other Finance Expenses
Other finance expenses remained stable at $0.9 million in each of the three months ended December 31, 2025 and December 31, 2024, respectively.
Loss on Derivatives
Amortization of deferred realized losses on interest rate swaps remained stable at $0.9 million in each of the three months ended December 31, 2025 and December 31, 2024.
Other Income/(Expenses), Net
Other income/(expenses), net, amounted to an expense of $0.1 million in the three months ended December 31, 2025 compared to an income of $2.8 million in the three months ended December 31, 2024. Other income/(expenses), net, for the three months ended December 31, 2024 primarily consisted of $2.1 million of cash collected from the bankruptcy trustee of Hanjin Shipping as a partial payment of our claim under the Hanjin bankruptcy proceedings.
Adjusted EBITDA
Adjusted EBITDA increased by 0.2%, or by $0.3 million, to $190.0 million in the three months ended December 31, 2025 from $189.7 million in the three months ended December 31, 2024. The increase was attributed to (i) $8.1 million increase in operating revenues, partially offset by (ii) $5.9 million increase in total operating expenses, (iii) $1.8 million decrease in dividends received, and (iv) $0.1 million increase in equity loss on investments. Adjusted EBITDA for the three months ended December 31, 2025 is adjusted for (i) $3.9 million gain from the change in fair value of investments, (ii) $14.8 million expense of stock based compensation and one-off discretionary cash bonus, and (iii) $1.4 million of loss on debt extinguishment. Tables reconciling Adjusted EBITDA to Net Income can be found at the end of this earnings release.
Adjusted EBITDA of container vessels segment decreased by $4.0 million, to $176.7 million in the three months ended December 31, 2025 from $180.7 million in the three months ended December 31, 2024.
Adjusted EBITDA of drybulk vessels segment increased by $6.1 million to $12.9 million in the three months ended December 31, 2025 from $6.8 million in the three months ended December 31, 2024.
Year ended December 31, 2025 compared to the year ended December 31, 2024
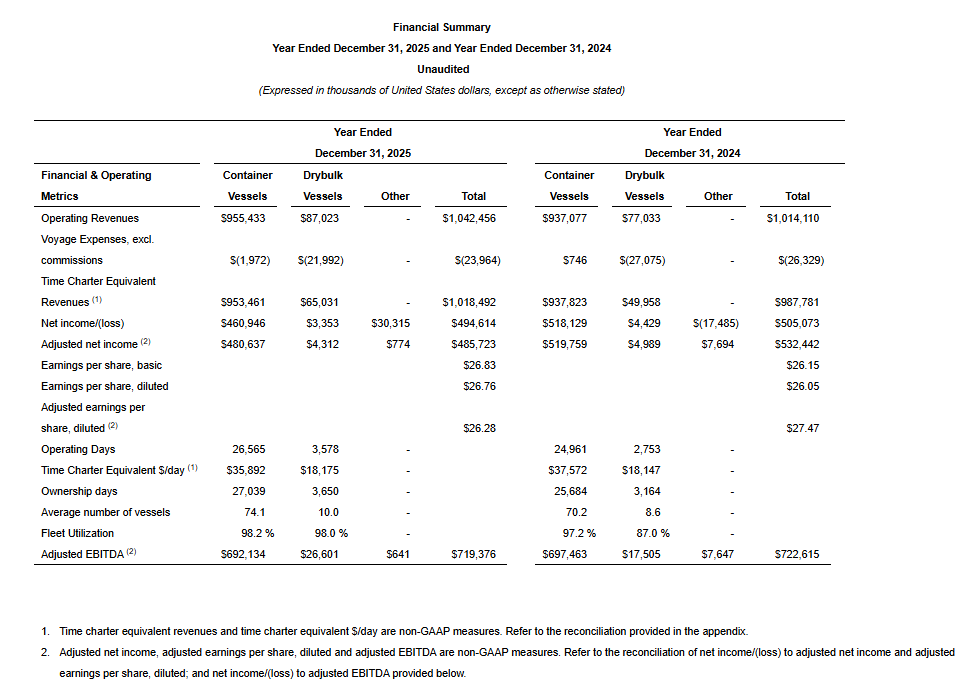
During the year ended December 31, 2025, Danaos had an average of 74.1 container vessels and 10 capesize drybulk vessels compared to 70.2 container vessels and 8.6 capesize drybulk vessels during the year ended December 31, 2024. Our container vessels utilization for the year ended December 31, 2025 was 98.2% compared to 97.2% in the year ended December 31, 2024. Our drybulk vessels utilization for the year ended December 31, 2025 was 98.0% compared to 87.0% in the year ended December 31, 2024.
Our adjusted net income amounted to $485.7 million, or $26.28 per diluted share, for the year ended December 31, 2025 compared to $532.4 million, or $27.47 per diluted share, for the year ended December 31, 2024. We have adjusted our net income in the year ended December 31, 2025 for a $29.5 million gain from the change in fair value of investments, a $14.7 million of stock based compensation expense and one-off discretionary cash bonus, a $3.5 million non-cash finance fees amortization and a $2.5 million loss on debt extinguishment.
Adjusted net income of our container vessels segment amounted to $480.6 million for the year ended December 31, 2025 compared to $519.8 million for the year ended December 31, 2024. We adjusted net income of container vessels segment in the year ended December 31, 2025 for a $13.7 million of stock based compensation expense and one-off discretionary cash bonus, a $3.5 million non-cash finance fees amortization and a $2.5 million loss on debt extinguishment.
Adjusted net income of our drybulk vessels segment amounted to $4.3 million for the year ended December 31, 2025 compared to $5.0 million for the year ended December 31, 2024. We adjusted net income of drybulk vessels segment in the year ended December 31, 2025 for a $1.0 million of stock based compensation expense and one-off discretionary cash bonus.
The $46.7 million decrease in adjusted net income for the year ended December 31, 2025 compared to the year ended December 31, 2024, is primarily attributable to (i) a $57.0 million increase in total operating expenses, (ii) a $7.6 million decrease in dividends received, (iii) a $9.0 million increase in net finance expenses, (iv) a $2.1 million decrease in claims received, offset by (iv) $28.3 million increase in operating revenues, and (v) a $0.7 million decrease in equity loss on investments.
Please refer to the Adjusted Net Income reconciliation tables, which appear later in this earnings release.
On a non-adjusted basis, our net income amounted to $494.6 million, or $26.76 earnings per diluted share, for the year ended December 31, 2025 compared to net income of $505.1 million, or $26.05 earnings per diluted share, for the year ended December 31, 2024. Our net income for the year ended December 31, 2025 includes $29.5 million gain on marketable securities (gross of dividend income) compared to $25.2 million loss on marketable securities (gross of dividend income) in the year ended December 31, 2024. On a non-adjusted basis, the net income of our container vessels segment amounted to $460.9 million for the year ended December 31, 2025 compared to $518.1 million for the year ended December 31, 2024. On a non-adjusted basis, the net income of our drybulk vessels segment amounted to $3.4 million for the year ended December 31, 2025 compared to $4.4 million net income for the year ended December 31, 2024.
Operating Revenues
Operating revenues increased by 2.8%, or by $28.4 million, to $1,042.5 million in the year ended December 31, 2025 from $1,014.1 million in the year ended December 31, 2024.
Operating revenues of our container vessels segment increased by 2.0%, or by $18.3 million, to $955.4 million in the year ended December 31, 2025 from $937.1 million in the year ended December 31, 2024, analyzed as follows:
- $60.1 million increase in revenues as a result of newbuilding containership vessel additions;
- $5.0 million increase in revenues as a result of higher fleet utilization between the two periods;
- $29.7 million decrease in revenues as a result of lower charter rates between the two periods;
- $16.9 million decrease in revenues due to lower non-cash revenue recognition in accordance with US GAAP;
- $0.2 million decrease in revenues due to the disposal of one containership vessel.
Operating revenues of our drybulk vessels segment increased by 13.0%, or by $10.0 million, to $87.0 million in the year ended December 31, 2025, compared to $77.0 million of revenues in the year ended December 31, 2024, analyzed as follows:
- $13.0 million increase in revenues as a result of dry bulk vessel acquisitions; and
- $3.0 million net decrease in revenues as a result of an increase in the deployment of our drybulk vessels through time charter contracts instead of voyage charter contracts between the two periods. Drybulk fleet utilization improved to 98% for 2025 from 87% in 2024, while the Time Charter Equivalent rate improved to $18,175 per day in 2025 from $18,147 per day in 2024.
Vessel Operating Expenses
Vessel operating expenses increased by $23.1 million to $208.8 million in the year ended December 31, 2025 from $185.7 million in the year ended December 31, 2024, primarily as a result of the increase in the average number of vessels in our fleet due to container vessel newbuilding deliveries and dry bulk vessels acquisitions and the increase in average daily operating cost of our vessels to $6,969 per vessel per day for the year ended December 31, 2025 compared to $6,606 per vessel per day for the year ended December 31, 2024. Management believes that our daily operating costs remain among the most competitive in the industry.
Depreciation & Amortization
Depreciation & Amortization includes Depreciation and Amortization of Deferred Drydocking and Special Survey Costs.
Depreciation
Depreciation expense increased by $15.1 million, to $163.4 million in the year ended December 31, 2025 from $148.3 million in the year ended December 31, 2024, due to the increase in the average number of vessels in our fleet.
Amortization of Deferred Drydocking and Special Survey Costs
Amortization of deferred drydocking and special survey costs increased by $14.9 million to $44.1 million in the year ended December 31, 2025 from $29.2 million in the year ended December 31, 2024, reflecting a larger number of vessels drydocked for which vessels drydocking amortization costs were recognized during the year ended December 31, 2025 compared to the year ended December 31, 2024.
General and Administrative Expenses
General and administrative expenses increased by $10.2 million, to $64.4 million in the year ended December 31, 2025 from $54.2 million in the year ended December 31, 2024. The increase was mainly attributable to a one-off discretionary cash bonus of $4.8 million distributed to certain employees, a $2.2 million increase in stock based compensation expense, a $2.0 million higher management fees due to the increase in the average number of vessels and a $1.2 million increase in corporate general and administrative expense, during the year ended December 31, 2025 compared to the year ended December 31, 2024.
Other Operating Expenses
Other Operating Expenses include Voyage Expenses.
Voyage Expenses
Voyage expenses decreased by $1.0 million to $63.1 million in the year ended December 31, 2025 from $64.1 million in the year ended December 31, 2024.
Voyage expenses of our drybulk vessels segment decreased by $4.3 million to $27.3 million in the year ended December 31, 2025 compared to $31.6 million voyage expenses in the year ended December 31, 2024. For the year ended December 31, 2025, voyage expenses of our drybulk vessels comprised of $5.3 million in commissions and $22.0 million in other voyage expenses, mainly comprised of bunkers cost and port expenses, compared to $4.5 million in commissions and $27.1 million in other voyage expenses for the year ended December 31, 2024, reflecting an increase in time charter employment of our dry bulk vessels during the year ended December 31, 2025 compared to the year ended December 31, 2024.
Voyage expenses of container vessels segment increased by $3.3 million to $35.8 million in the year ended December 31, 2025 from $32.5 million in the year ended December 31, 2024, mainly due to increased other voyage expenses.
Interest Expense and Interest Income
Interest expense increased by $16.6 million, to $42.8 million in the year ended December 31, 2025 from $26.2 million in the year ended December 31, 2024. The increase in interest expense is a result of:
- $15.6 million increase in interest expense due to an increase in our average indebtedness by $286.7 million between the two periods, partially offset by a decrease in our average debt service cost. Average indebtedness was $867.3 million in the year ended December 31, 2025, compared to average indebtedness of $580.6 million in the year ended December 31, 2024, while our average debt service cost decreased by approximately 0.76% mainly as a result of lower SOFR rates between the two periods;
- $1.2 million increase in the amortization of deferred finance costs and debt discount between the two periods; and
- $0.2 million decrease in interest expense due to an increase in the amount of interest expense capitalized on our vessels under construction that was $21.7 million in the year ended December 31, 2025, when compared to capitalized interest of $21.5 million in the year ended December 31, 2024.
As of December 31, 2025, our outstanding debt, gross of deferred finance costs, was $1,177.8 million, which include $262.8 million principal amount of the 8.5% Senior Notes and $500.0 million principal amount of the 6.875% Senior Notes. These balances compare to debt of $744.5 million, which included $262.8 million principal amount of the 8.5% Senior Notes as of December 31, 2024. The increase in our outstanding debt is mainly due to (i) the issuance of the $500.0 million aggregate principal amount of the 6.875% Senior Notes in October 2025, (ii) the loans drawn down to partially finance our container vessel newbuildings, partially offset by (iii) the early prepayment of two secured facilities.
Interest income increased by $6.6 million to $19.5 million in the year ended December 31, 2025 compared to $12.9 million in the year ended December 31, 2024, mainly driven by higher average cash balances between the two periods, partially offset by lower interest rates on cash deposits between the corresponding periods.
Gain/(Loss) on Investments
The $31.2 million gain on investments in the year ended December 31, 2025 consisted of the gain from the change in fair value of our shareholding interest in Star Bulk Carriers Corp. (“SBLK”) of $29.5 million and dividend income on these shares of $1.7 million. This compares to a $15.9 million loss on investments in the year ended December 31, 2024, representing a $25.2 million loss from the change in fair value on our SBLK shareholding interest and dividend income on these shares of $9.3 million.
Loss on Debt Extinguishment
The loss on debt extinguishment of $2.5 million in the year ended December 31, 2025 related to our early extinguishment of debt compared to nil in the year ended December 31, 2024.
Equity Loss on Investments
Equity loss on investments amounting to $1.0 million and $1.6 million in the years ended December 31, 2025 and December 31, 2024, respectively, relates to our share of initial expenses of CTTC, currently engaged in the research and development of decarbonization technologies for the shipping industry.
Other Finance Expenses
Other finance expenses increased by $0.1 million to $3.7 million in the year ended December 31, 2025 compared to $3.6 million in the year ended December 31, 2024.
Loss on Derivatives
Amortization of deferred realized losses on interest rate swaps remained stable at $3.6 million in each of the years ended December 31, 2025 and December 31, 2024.
Other Income/(Expenses), Net
Other income/(expenses), net, amounted to an expense of $1.2 million in the year ended December 31, 2025, compared to an income of $2.2 million in the year ended December 31, 2024. Other income/(expenses), net, for the year ended December 31, 2024 mainly consisted of income of $2.1 million related to cash collected from the bankruptcy trustee of Hanjin Shipping as a partial payment of our claim under the Hanjin bankruptcy proceedings.
Adjusted EBITDA
Adjusted EBITDA decreased by 0.4%, or by $3.2 million, to $719.4 million in the year ended December 31, 2025 from $722.6 million in the year ended December 31, 2024. The decrease was attributed to (i) $28.6 million increase in total operating expenses, (ii) $7.6 million decrease in dividends received, (iii) $0.5 million increase in net financing expenses, partially offset by (iv) $32.9 million increase in operating revenues (excluding $4.5 million decrease in amortization of assumed time-charters), and (ii) $0.6 million decrease in equity loss on investments. Adjusted EBITDA for the year ended December 31, 2025 is adjusted for (i) $29.5 million gain from the change in fair value of investments, (ii) $15.2 million expense of stock based compensation and one-off discretionary cash bonus, and (iii) $2.5 million of loss on debt extinguishment.
Adjusted EBITDA of container vessels segment decreased by $5.4 million, to $692.1 million in the year ended December 31, 2025 from $697.5 million in the year ended December 31, 2024.
Adjusted EBITDA of drybulk vessels segment increased by $9.1 million to $26.6 million in the year ended December 31, 2025 from $17.5 million in the year ended December 31, 2024.
Dividend Payment
Danaos has declared a dividend of $0.90 per share of common stock for the fourth quarter of 2025, which is payable on March 4, 2026 to stockholders of record as of February 23, 2026.
Recent Developments
On January 15, 2026, we received $80.0 million pursuant to a Japanese Operating Lease with Call Option for the vessel Greenhouse (the “JOLCO Greenhouse Facility”) with a tenor of eight years.
We have delivered a notice of redemption to redeem in full the 8.5% Senior Notes on March 2, 2026, for an aggregate redemption price that is expected to be approximately $273.9 million, consisting of $262.8 million of outstanding principal and approximately $11.2 million of accrued but unpaid interest, assuming a redemption date of March 2, 2026.
On January 20, 2026, the Company announced a strategic partnership with Glenfarne Group to advance the Alaska LNG project. This partnership includes a $50 million development capital equity investment in Glenfarne Alaska Partners LLC. In addition, Danaos Corporation will also be the preferred tonnage provider to construct and operate at least six LNG carriers to deliver LNG to global customers for Glenfarne Alaska LNG, LLC, majority owner and developer of the Alaska LNG Project. This transaction provides Danaos with an opportunity to capitalize on its expertise in global seaborne transportation and expand the footprint of Danaos in the LNG and Energy segments.