

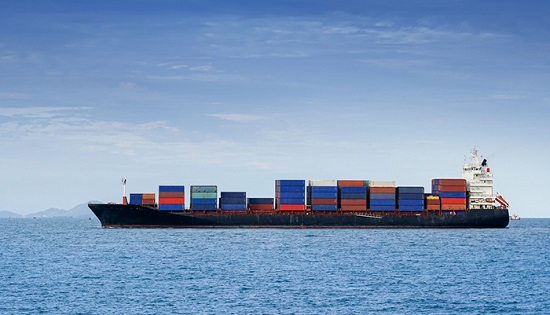
Global Ship Lease, Inc., an owner of containerships, announced its unaudited results for the three and six-month periods ended June 30, 2026.
Second Quarter of 2026 and Year to Date Highlights and Other Recent Developments
– 2Q 2026 operating revenue of $198.7 million. 1H 2026 operating revenue of $396.8 million.
– 2Q 2026 net income available to common shareholders of $89.3 million, or $2.48 Earnings per Share (EPS). 1H 2026 net income available to common shareholders of $180.7 million, or $5.02 EPS.
– 2Q 2026 normalized net income (a non-U.S. GAAP financial measure, described below)3 of $89.3 million, or $2.48 normalized EPS³. 1H 2026 normalized net income of $181.4 million, or $5.04 normalized EPS.
– 2Q 2026 Adjusted EBITDA (a non-U.S. GAAP financial measure, described below)3 of $131.4 million. 1H 2026 Adjusted EBITDA of $264.6 million.
– In June 2026, announced that we have agreed individual newbuilding contracts for 15 mid-size, ultra-high-reefer, wide-beam, latest-generation containerships (“Newbuildings”) for an aggregate purchase price of approximately $1.3 billion. These highly flexible ships have been designed and specified to ensure a superior fit for existing and future market needs, with deliveries scheduled to take place between the fourth quarter of 2028 and the first quarter of 2030. Upon delivery from the respective shipyards, the Newbuildings are contracted to commence employment on multi-year charters, with an average TEU-weighted firm charter term of 7.1 years and at rates expected to generate more than $1.0 billion of Adjusted EBITDA.
– Added $1.45 billion of contracted revenues during 1H 2026 from new charters and extensions on our existing fleet and initial firm charters from the 15 Newbuildings, bringing total contracted revenues as of June 30, 2026, to $3.2 billion, over a TEU-weighted average remaining duration (assuming median firm charter periods) of 3.3 years.
– Declared a dividend of $0.625 per Class A common share for the second quarter of 2026, to be paid on September 3, 2026 to Class A common shareholders of record as of August 21, 2026. Paid a dividend of $0.625 per Class A common share for the first quarter of 2026 on June 3, 2026.
– On June 16, 2026, announced updates by two leading credit rating agencies. Moody’s Investor Service maintained our Ba2 Corporate Family Rating, and upgraded to a positive outlook from a stable outlook. Kroll Bond Rating Agency maintained our corporate credit rating at BB+, with a stable outlook, while also affirming the BBB/stable investment grade rating and stable outlook for our 5.69% Senior Secured Notes due July 15, 2027 (the “2027 Secured Notes”). In addition, on July 7, 2026, S&P Global issued a press release maintaining our Issuer Credit Rating for GSL of BB+, with a stable outlook.
– During April and May of 2026, we entered into agreements for the forward sales of four non-core ships, built 2000 – 2002, for an aggregate price of $65.5 million and an anticipated gain on sale of approximately $33.0 million. The ships are scheduled to be delivered to the buyers upon expiry of the vessels’ respective charters: Manet, Kumasi and Julie (2,200 TEU, 2001/2-built) in 4Q 2026, 1Q 2027 and 3Q 2027, respectively, and Ian H (5,900 TEU, 2000-built) in 4Q 2027.
– On December 1, 2025, announced the purchase of three 8,586 TEU Korean-built containerships with ECO upgrades (the “Three Newly Acquired Vessels”) for an aggregate purchase price of $90.0 million. Two of the vessels were delivered to us in December 2025 and the third was delivered to us in January 2026. In June 2026, we entered into a loan agreement with Bank of America for $55.5 million to finance these acquisitions. The loan bears interest at SOFR + 1.40% and has a maturity of five years.
George Youroukos, our Executive Chairman, stated: “We are proud to have delivered another quarter of strong results, as our strategic focus on optionality and flexible tonnage continues to serve us well in a highly volatile and unpredictable world. While underlying containerized freight flows remained quite firm throughout the quarter, geopolitics once again played an outsized role in re-arranging and complicating global trade. This was evident not only in and around the Strait of Hormuz, but also in the continued decentralization of global supply chains outside of China and beyond the East-West mainlane trades serviced by ultra-large containership tonnage. As a result, our liner customers are placing a premium on flexibility and reliability in the supply chain, actively expanding their access to flexible, mid-size containerships like those in the GSL fleet. In these conditions, we have taken the opportunity to continue locking in multi-year charters at attractive rates. With 100% charter coverage for 2026, 90% coverage for 2027, and over $3 billion in contracted revenues over 3.3 years, including our Newbuildings, we are in a strong position now and moving forward.
“We have long appreciated that a combination of patience, discipline and the ability to act quickly is essential to successful fleet investment. On that basis, we are very pleased to have complemented our ongoing on-the-water investment strategy with the addition of highly attractive newbuilding orders for 15 mid-size, ultra-high-reefer, wide-beam, latest generation ECO newbuildings. The initial charters for the Newbuildings, averaging just over 7 years in duration, de-risk the investment right out of the gate, providing expected adjusted EBITDA equivalent to over 75% of the contracted purchase price within 25% of the ships’ expected economic life. Thereafter, we believe that the highly optimized specification and flexibility of these vessels position them to be the workhorses of global containerized trade for many years to come. With charters for five of the 15 Newbuildings structured to include extension options at rates 25% above their initial levels, it is clear that we are not alone in this view. In summary, these high-upside, low-downside risk Newbuildings meet our long-established, demanding investment criteria while also significantly reducing our average fleet age and providing a runway for reliable cash generation throughout the years ahead.”
Thomas Lister, our Chief Executive Officer, stated: “Optionality remains at the core of our approach to an ever more complex and dynamic containerized trade landscape. As the industry grapples with an ever-expanding series of unpredictable and sometimes dangerous geopolitical developments, it remains imperative that we all keep the welfare of seafarers front-of-mind. Amid this environment, we have continued to find prudent, attractive opportunities to unlock value across finance, operations, chartering, selective divestments and fleet renewal. The strength of our fortress balance sheet and our disciplined capital allocation and decision-making have been affirmed by successive enhancements to our credit ratings and outlooks, and those in turn have provided yet further support to our ability to pay a robust dividend while also being nimble enough to pounce on exciting opportunities to partner with top liners in the newbuild market. Our joint commitment to optionality maximization and decisive, opportunistic action is driving this progress on all fronts, enabling us to create lasting shareholder value amidst both natural cyclicality and unprecedented geopolitical tumult.”
Operating Revenues and Utilization
Operating revenues derived from fixed-rate, mainly long-term, time-charters were $198.7 million in the second quarter of 2026, up $6.8 million (or 3.5%) on operating revenues of $191.9 million in the prior year period. The period-on-period increase in operating revenues was principally due to (i) the net effect of higher rates on charter renewals, (ii) the addition of the Three Newly Acquired Vessels offset by the sale of Dimitris Y in the fourth quarter of 2025 and (iii) a non-cash $3.1 million increase in the amortization of intangible liabilities arising from below-market charters attached to certain vessel additions counterbalanced by a non-cash $0.4 million negative effect from straight lining time charter modifications. There were 210 days of offhire in the second quarter of 2026, of which 181 were for scheduled drydockings, compared to 182 days of offhire and idle time in the prior year period, of which 145 were for scheduled drydockings. Utilization for the second quarter of 2026 was 96.7% compared to utilization of 97.1% in the prior year period.
For the six months ended June 30, 2026, operating revenues were $396.8 million, up $14.0 million (or 3.7%) on operating revenues of $382.8 million in the comparative period, mainly due to (i) the net effect of higher rates on charter renewals, (ii) the addition of the Three Newly Acquired Vessels offset by the sales of four vessels in 2025 (Tasman, Keta, Akiteta and Dimitris Y) and (iii) a non-cash $6.1 million increase in the amortization of intangible liabilities arising from below-market charters attached to certain vessel additions counterbalanced by a non-cash $1.7 million negative effect from straight lining time charter modifications. There were 328 days of offhire in the six-month period ended June 30, 2026, of which 265 were for scheduled drydockings, compared to 588 days of offhire and idle time in the prior year period, of which 475 were for scheduled drydockings. Utilization for the six-month period ended June 30, 2026 was 97.4% compared to utilization of 95.4% in the prior year period.
During the six-month period ended in June 30, 2026, we completed four drydockings. As of June 30, 2026, one regulatory drydocking was in progress and 11 further regulatory drydockings are anticipated in 2026.
Vessel Operating Expenses
Vessel operating expenses, which are primarily the costs of crew, lubricating oil, repairs, maintenance, insurance and technical management fees, were up 12.9% to $57.0 million for the second quarter of 2026 or an average of $8,821 per day, compared to $50.5 million in the prior year period, or an average of $8,045 per day. The increase of $6.5 million was mainly due to (i) the addition of the Three Newly Acquired Vessels offset by the sale of Dimitris Y in the fourth quarter of 2025, (ii) an increase in crew expenses following the continued strength of the market that led to crew shortage, resulting in an increase in crew wages by approximately 5.0%, (iii) an increase in stores, spares and maintenance expenses for planned main engine maintenance and overhaul of diesel generators as well as main engine annual spares delivery due to timing of planned schedule, (iv) an increase in annual premiums for all P&I Clubs and (v) the impact of inflation on fees and expenses, including management fees.
For the six-month period ended June 30, 2026, vessel operating expenses were $109.7 million, or an average of $8,543 per day, compared to $100.5 million in the comparative period, or $7,925 per day, an increase of $618 per ownership day, or 7.8%. The increase of $9.2 million was mainly due to (i) the addition of the Three Newly Acquired Vessels offset by the sale of four vessels in 2025, (ii) an increase in crew expenses following our decision to increase the number of seafarers on board to improve the vessels’ conditions, (iii) an increase in stores, spares and maintenance expenses for planned main engine maintenance and overhaul of diesel generators as well as main engine annual spares delivery due to timing of planned schedule, (iv) an increase in annual premiums for all P&I Clubs and (v) the impact of inflation on fees and expenses, including management fees.
Time Charter and Voyage Expenses
Time charter and voyage expenses comprise mainly commissions paid to ship brokers, the cost of bunker fuel for owner’s account when a ship is off-hire or idle, and miscellaneous owner’s costs associated with a ship’s voyage. Time charter and voyage expenses were $6.5 million for the second quarter of 2026, compared to $5.1 million in the prior year period due to (i) increase in voyage administration costs and operational requests from charterers and (ii) increase in brokerage commissions on charter renewals at higher rates.
For the six-month period ended June 30, 2026, time charter and voyage expenses were $12.1 million, or an average of $941 per day, compared to $11.6 million in the comparative period, or $915 per day, an increase of $26 per ownership day, or 2.8% mainly due to increased commissions on charter renewals at higher rates.
Depreciation and Amortization
Depreciation and amortization for the second quarter of 2026 was $34.2 million, compared to $30.3 million in the prior year period. The increase was mainly due to the nine drydockings completed after June 30, 2025 and the addition of the Three Newly Acquired Vessels offset by the sale of Dimitris Y in the fourth quarter of 2025.
Depreciation and amortization for the six-month period ended June 30, 2026 was $67.7 million, compared to $60.1 million in the comparative period, mainly due to the factors noted above offset by the sale of four vessels in 2025.
General and Administrative Expenses
General and administrative expenses were $7.2 million in the second quarter of 2026, compared to $4.1 million in the comparative period. The increase was mainly due to the non-cash charge for stock based compensation expense recognized in relation to the valuation of awards of Class A common shares under our Equity Incentive Plan.
General and administrative expenses were $16.0 million for the six-month period ended June 30, 2026, compared to $8.7 million in the comparative period mainly due to the factors noted above.
Gain on sale of vessels
Tasman (5,900 TEU, built 2000), Akiteta (2,200 TEU, built 2002), and Keta (2,200 TEU, built 2003) were sold for an aggregate gain of $28.3 million in the first quarter of 2025. None of our vessels were sold during the first half of 2026.
Adjusted EBITDA1
Adjusted EBITDA was $131.4 million for the second quarter of 2026, down from $134.2 million for the prior year period, with the net decrease being mainly due to increased operating and voyage expenses.
Adjusted EBITDA for the six-month period ended June 30, 2026 was $264.6 million, compared to $266.5 million for the comparative period, a decrease of $1.9 million or 0.7% mainly due to the reasons noted above.
Interest Expense and Interest Income
Debt as of June 30, 2026 totaled $676.4 million, comprising $328.5 million of secured bank debt collateralized by vessels, $153.1 million of our 2027 Secured Notes collateralized by vessels, and $194.8 million under sale and leaseback financing transactions. As of June 30, 2026, 21 of our vessels were unencumbered.
Debt as at June 30, 2025 totaled $768.5 million, comprising $349.0 million of secured bank debt collateralized by vessels, $205.6 million of 2027 Secured Notes collateralized by vessels, and $213.9 million under sale and leaseback financing transactions. As of June 30, 2025, 16 of our vessels were unencumbered.
Interest and other finance expenses for the second quarter of 2026 were $9.4 million, down from $10.6 million for the prior year period. The decrease was due to the lower amortization expense of our deferred loan fees.
Interest and other finance expenses for the six-month period ended June 30, 2026 were $18.8 million, down from $20.5 million for the prior year period. Interest expense of 2025 included (i) a prepayment fee of $0.2 million following the full repayment of the Macquarie Credit Facility and (ii) the non-cash write off of deferred financing costs of $0.7 million on the full repayments of the Macquarie Credit Facility, the HCOB-CACIB Credit Facility and the ESUN Credit Facility.
Interest income for the second quarter of 2026 was $5.6 million, up from $4.7 million for the prior year period mainly due to higher invested amounts.
Interest income for the six-month period ended June 30, 2026 was $11.3 million, up from $7.9 million for the prior year period mainly due to higher invested amounts.
Other income, net
Other income, net was $1.9 million in the second quarter of 2026, up from $0.8 million in the comparative period.
Other income, net was $2.9 million in the six-month period ended June 30, 2026, down from $4.0 million in the comparative period.
Fair value adjustment on derivatives and other financial instruments
In December 2021, we entered into a USD 1-month LIBOR interest rate cap of 0.75% through the fourth quarter of 2026 on $484.1 million of floating rate debt, which reduces over time in-line with anticipated debt amortization and represented approximately half of the outstanding floating rate debt. In February 2022, we entered into two additional USD 1-month LIBOR interest rate caps of 0.75% through the fourth quarter of 2026 on the remaining balance of $507.9 million of floating rate debt. As a result of the discontinuation of LIBOR, on July 1, 2023, our interest rate caps automatically transited to 1 month Compounded SOFR at a net rate of 0.64%. A negative fair value adjustment of $1.1 million for the six-month period ended June 30, 2026 was recorded through the statement of income.
In January 2026, we entered into a series of FX Reverse Convertible transactions with UBS AG to hedge our exposure to foreign exchange risk while also achieving improved interest income on deposits. These instruments are USD-denominated structured notes with returns linked to the EUR/USD exchange rate. We elected the Fair Value Option to measure these instruments.
Earnings Allocated to Preferred Shares
Our Series B Preferred Shares carry a coupon of 8.75%, the cost of which for the second quarter of 2026 was $2.4 million, the same as in the prior year period.
The cost for the six months ended June 30, 2026 was $4.8 million, the same as in the prior year period.
Net Income Available to Common Shareholders
Net income available to common shareholders for the second quarter of 2026 was $89.3 million. Net income available to common shareholders for the prior year period was $93.1 million.
Earnings per share for the second quarter of 2026 was $2.48, a decrease of 5.0% from the earnings per share for the prior year period, which was $2.61.
Net income available to common shareholders for the six months ended June 30, 2026 was $180.7 million. Net income available to common shareholders for the prior year period was $214.1 million. Net income available to common shareholders for the prior year period included a $28.3 million gain from the sales of Tasman (5,900 TEU, built 2000), Akiteta (2,200 TEU, built 2002), and Keta (2,200 TEU, built 2003).
Earnings per share for the six months ended June 30, 2026 was $5.02, a decrease of 16.5% from the earnings per share for the prior year period, which was $6.01.
Normalized net income1 for the second quarter of 2026 was $89.3 million. Normalized net income for the prior year period was $95.1 million. Normalized earnings per share1 for the second quarter of 2026 was $2.48, a decrease of 7.1% from Normalized earnings per share for the prior year period, which was $2.67.
Normalized net income1 for the six months ended June 30, 2026 was $181.4 million. Normalized net income for the prior year period was $189.4 million. Normalized earnings per share1 for the six months ended June 30, 2026 was $5.04, a decrease of 5.3% from Normalized earnings per share for the prior year period, which was $5.32.
Fleet
As of June 30, 2026, our fleet consisted of (i) 71 operating containerships and (ii) 15 containerships under construction with scheduled deliveries between the fourth quarter of 2028 and the first quarter of 2030.